What gets measured gets improved. Data is a valuable source of identifying how people behave and making educated improvements to your online business, that’s why it’s such a widely discussed topic.
If you still don’t have access to the Google Analytics account of your website, you’re missing out. Google Analytics is a free powerful tool from the search giant, which helps you track the performance of your website and provide insight into how visitors are using your website. With Google Analytics you can also get to know how you should go along with the overall design and user experience of your website by efficiently monitoring the metrics that are most important to your business.
The only disadvantage is that it can be overwhelming as it contains an enormous amount of information to sift through, and you have to understand what the terms and numbers mean to translate the information into actionable steps to improve your website. Who has time to search for the meanings and explanations of the complicated world of web analytics when you’re trying to manage a business?
Luckily, that’s where we come in!
1. Set up
It’s extremely easy to set everything up and get started. Simply sign into your Google account and head over to Analytics. What you’ll need to do is go to the Admin panel and click “Add account”. From there on in you just fill in some very basic information about your website to receive your Tracking ID. After that you’re ready to install your HTML tracking code into the source code of your website. This code is essentially how Google Analytics taps into and captures your website’s usage statistics.
Now that you’re all set up, here are the most important metrics simplified and explained.
2. Users & Sessions
Find these metrics through Audience > Overview.
The explanation
The visitor count is something you will keep a close eye on because it helps you see if you’re increasing traffic to your website. As Google defines it, ‘The Users metric shows how many unique users viewed or interacted with your content within a specific date range.’ On the other hand, one single session can contain multiple pageviews, events, social interactions, and ecommerce transactions.
The interpretation
The fewer uniques you see as compared with your total visitation (sessions), the more loyal your audience is. So, if the number of visitations is a lot higher than the number of uniques it means that your users are visiting more pages, interacting more, and there’s more chance that they will decide to choose your services or make a purchase from your website.
While you want to build a loyal following, getting new people to your website is the way to grow your presence. Make sure you get maximum exposure to attract more uniques, by focusing on the right keywords, getting active on social media, and promoting your content.
3. Bounce Rate and Average Visit Duration
Find these metrics through Audience > Overview.
The explanation
These are actually two metrics, but they’re related. Bounce rate is the percentage of users who leave immediately after seeing one page. Average visit duration is the the amount of time spent on the site. A low bounce rate and high visit duration tells you that people find your website useful and valuable.
The interpretation
The reality is not everyone is going to like your content. The bounce rate is essentially the percentage of people who leave your website from the same page they entered without any interaction with the page. For a visitor to be measured in the Bounce Rate they must have come to your website, only looked at the one page, and then left your website immediately.
Ideally you want to keep this percentage low. If you think the bounce rate is high, take a look at the average time spent, exit pages, and where visitors are clicking (see In-Page Analytics below).
According to Neil Patel, these are the benchmark averages for bounce rates:
If you would like to lower your bounce rate and increase the time users spend on you website, you have to make sure that you enhance the quality of your content, have strong opening paragraphs and make sure that users don’t have to wait too long for your website to load.
4. Browser & OS
Find these metrics through Audience > Technology > Browser & OS (for cross browser usability).
Every website should look good on every type of browser, operating system and different screen sizes. If you monitor these metrics well, you can make various changes on how your website appears online. The ‘Browser & OS’ is a very useful metric that will give you an indication of what is the most popular browser that users are using to access your site. This is great for cross-browser usability, because by knowing the most popular browser with your users, you can make sure that your website looks great on that particular browser.
5. Mobile
Find these metrics through Audience > Mobile > Overview (for responsive websites – decisions).
It is also crucial to know how many visitors are accessing your site through mobile devices. As time goes by, you are going to experience a rise in visitors that access your website through mobile devices, so you’d better prepare to optimise your site to a responsive one if it still isn’t.
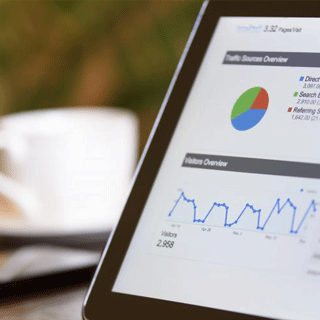
6. Traffic Sources
Find these metrics through Acquisition > Overview.
Find these metrics through Acquisition > All Traffic.
The ‘All Traffic’ report details how many people visited your site and where that they came from. Traffic sources can be divided into 5 channels as explained below:
Direct – Typed your URL in the browser.
Social – Visits that came through social media platforms.
Paid Search – Visits that are tracked through pre-defined campaigns.
Referral – Clicked on a link from another website that linked back to you.
Organic Search – Found your website using a search engine (i.e.Google).
Another handy feature here is that it helps track where your content is online. You’ll also notice social networks on your list of referrers which is great for analysing which social network brings in the most visitors. Your business needs an effective keyword strategy and its goal should be to show up on the first search page for specific keywords associated with your business. This goal is important because usually users never scroll beyond the first page of search results.
7. Keywords
Find these metrics through Acquisition > Keywords (Paid & Organic).
The Keywords (Paid & Organic) report shows what keywords visitors used to find your website. This report will help you measure the success of your search engine optimisation campaign. You want to make sure that the keywords that appear in this report are the ones you want to be associated with you and your content.
8. Popular pages
Find these metrics through Behaviour > Site Content > All pages.
Here is where you evaluate which content is the most popular on your website. Take a look and see which pages get the most views and how long people are staying on the page. After a while of publishing content you’ll notice patterns and see which posts perform better.
Remember it’s about publishing content your audience wants to read, so if a particular style of writing appears to getting more views, stick to that style.
9. Landing & Exit Pages
Find this metric through Content > Site Content > Landing Pages.
Find this metric through Content > Site Content > Exit Pages.
We’ve looked at how people are finding your site, but this report tells us the exact pages visitors are landing on. Knowing how visitors are entering your site is key for creating a successful sales funnel. Are your top landing pages optimised to convert leads? Do they have calls to action? They should because having an engaging CTA on a popular landing page will improve your website’s lead generation metrics.
It’s very useful to get to know what is sending your visitors away. The Exit Page report will show us what pages visitors are leaving the site from. Take a close look at your top ten pages and make sure they’re the pages you want people to be leaving your site from. For example you want users to exit from thank you pages, so that you will know that they subscribed. On the other hand, you don’t want users to exit from your homepage, because that simply means that users weren’t interested to continue viewing other pages.
10. In-Page Analytics
Find these metrics through Behaviour > In-Page Analytics.
You can also use In-Page Analytics to see how users really interact with web pages. To make analysis easier, Google Analytics includes a variety of charts to display information just as you want to see it. Here you’ll be presented with a map that lets you view where your visitors are clicking. This feature helps find out how your visitors are interacting with your website.
For instance, if you’ve got a button nobody is clicking on, you might want to change the design or consider a different value proposition and call to action. Another benefit is to find out how many people scroll below the fold and read the content at the bottom.
There you have it!
Keep in mind that the online marketing for your business is a moving target. You will never reach a point where your website is finished. To keep your focus on an ever-improving bottom line, you must change what isn’t working and enhance what is. Knowledge is power, after all, so stay informed by checking in regularly on some of the most important numbers concerning your business.